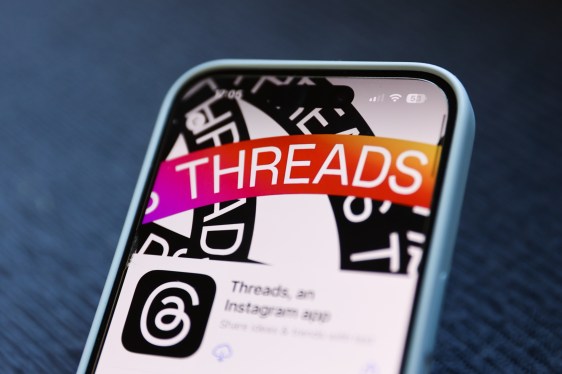
Threads is rolling out enhanced metrics to help users gain a clearer understanding of how their posts are performing and where their content is being discovered, the company announced on Tuesday. With these updates, users can now access more detailed information through the platform’s “Insights” dashboard.
When users navigate to the “Interactions” section, they will find engagement metrics broken down by likes, replies, quotes, and reposts. The “Followers” section offers insights into follower growth, including geographic data such as top cities and countries, along with demographic information like age range and gender.
Additionally, a new chart feature allows users to track changes in post performance over time, showcasing trends within a seven- to 90-day period. Since eligible Threads posts can be recommended to people on Instagram and Facebook, Threads now lets users see where their audience is encountering their content. This includes the percentage of views driven by each app.
These updates from Meta-owned Threads are designed to help creators build their audiences, expand their presence, and understand the types of content that resonate most with their followers.
Threads is growing rapidly. According to recent data from market intelligence provider Similarweb, the platform is closing the gap with its top competitor, X, in terms of mobile app users. In June 2025, Threads’ mobile app for iOS and Android recorded 115.1 million daily active users, marking a 127.8% year-over-year growth. In contrast, X reached 132 million daily active users but experienced a 15.2% decline in year-over-year growth.
As Threads continues to challenge established social networks, it makes sense for the platform to provide creators with stronger tools to cultivate their presence and succeed in an increasingly competitive environment.